Building OSS Map Apps With Observable Framework
Motivation
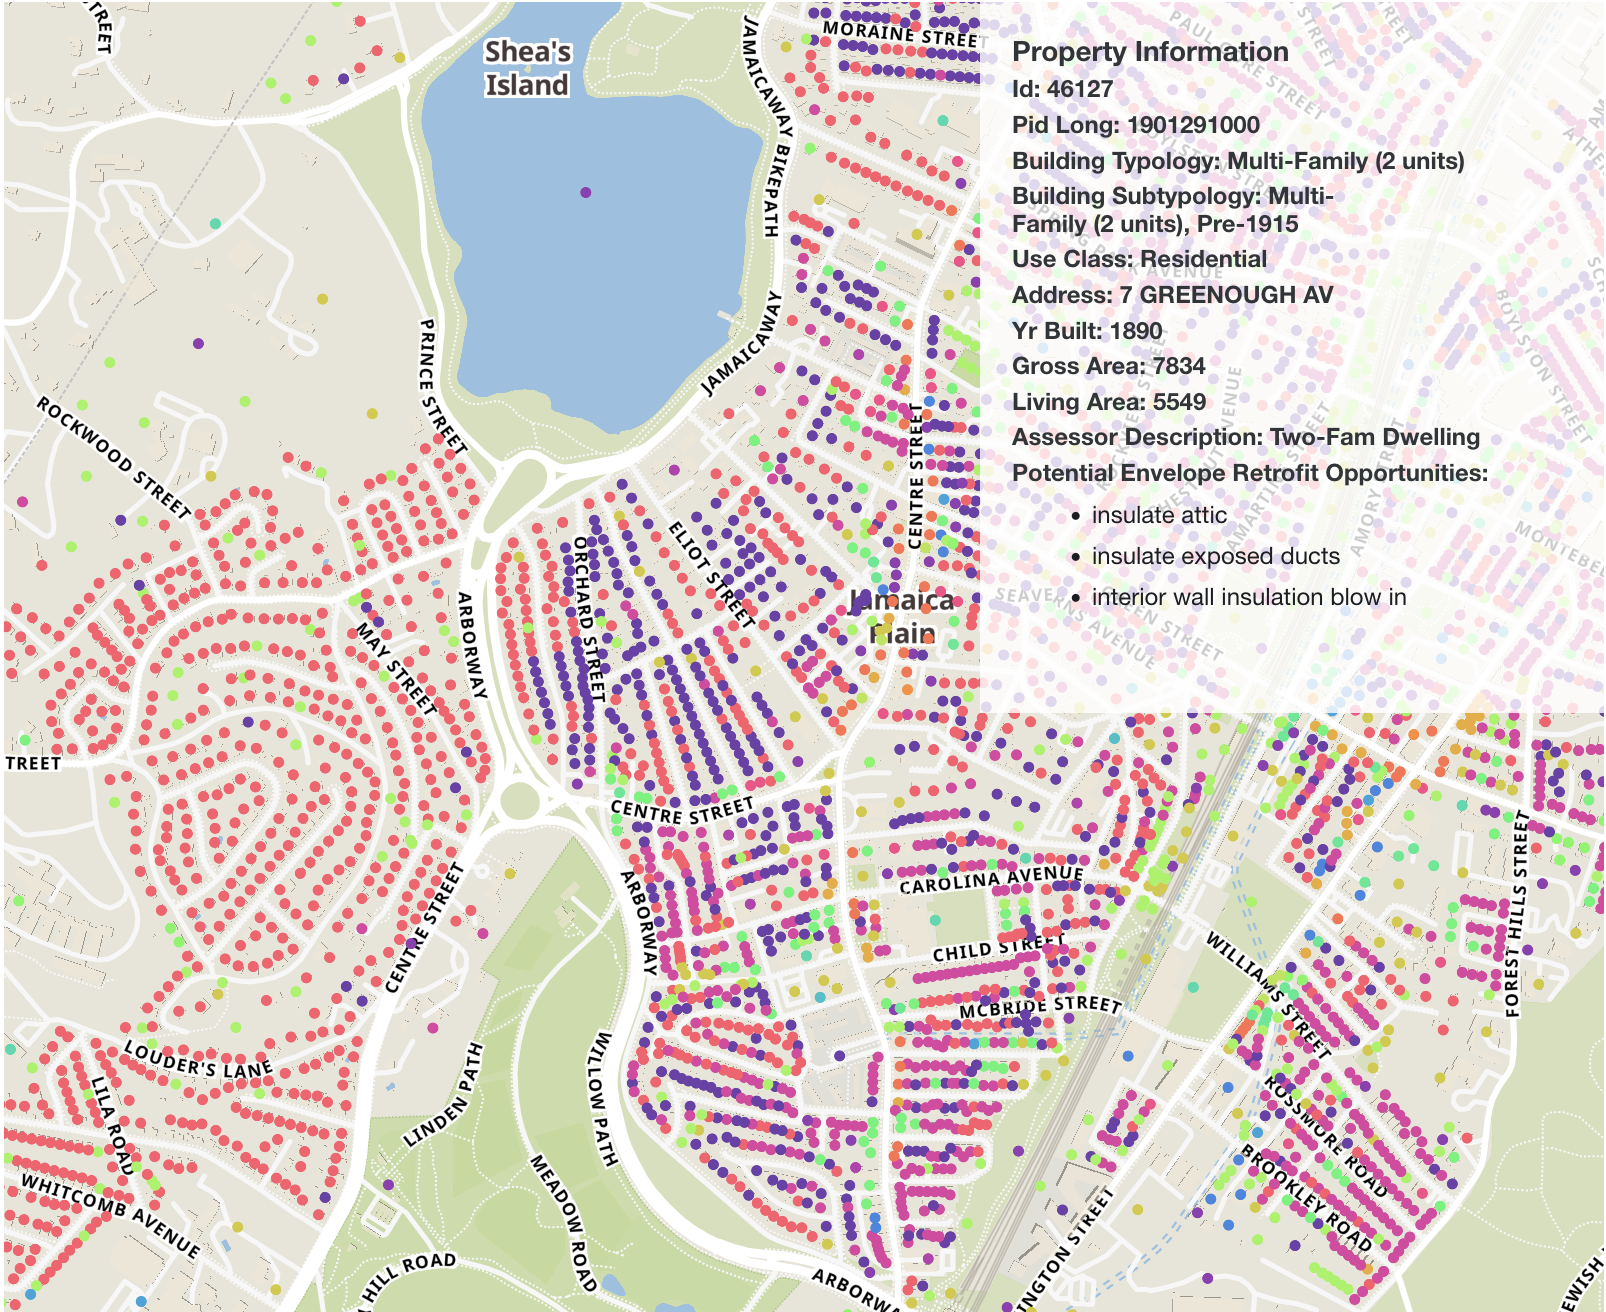
I've been a pretty heavy user of Observable since 2021. It was my initial entry point to learning and working with D3, and I still use the notebook interface heavily for prototyping and exploring public datasets. When I saw the announcement for Observable Framework, it seemed like a no brainer that would support a lot of the visualizations I like to build (and help me do so quickly). I've been working with open source mapping lately, and I saw in the initial documentation that there was Mapbox support. I wanted to see how difficult it would be to build maps with Observable Framework using open source libraries (my preferred stack of Maplibre and Protomaps), so I prototyped this interactive map of potential energy efficient retrofits of Boston buildings over the past few weekends.
Dataset Selection
The city of Boston has a number of great datasets about its buildings, including an aggregated view around its efforts in sustainability and energy efficiency, called the Boston Building Inventory. From the docs:
"This dataset pulls from many different data sources to identify individual building characteristics of all buildings in Boston. It also identifies high-potential retrofit options to reduce carbon emissions in multifamily buildings, using the best available data and assumptions from building experts."
There are a few different components included with the dataset, including explanations of the potential retrofits, as well as a presentation providing further motivation for the project. I first took a look at the raw data using Visidata before deciding to focus on mapping a subset of the data, only looking at the envelope retrofit strategies (which I have more familiarity with as a structural engineer).
Starting an Observable Framework Project
I started my Observable Framework project with default settings to launch the initial template application (I chose npm for my package management setup because I have very few opinions on the js package management hellscape). I did appreciate that Observable allows you to opt in on telemetry data given that the Framework library is open source.
Data Loaders
The key differentiator for me with Observable Framework vs. other static site generators is the data loader functionality. Most of the datasets that I work with are around building data, which is updated at most once a day (and in some cases, like Bridge.watch, only once a year!) The language-agnostic implementation means that I can easily build loaders in whichever programming language I need to (maybe even Rust 😈...), and then make a cron job on my server that would run the loader and deploy the static site once a day. For this visualization, I could just use NodeJS for my loader, but quite often I'll do data cleaning in Visidata and export the list of commands used within Visidata to generate a Python/Pandas script.
For the Boston Buildings Inventory, I needed to stitch two data sets together. The retrofit potential data only had parcel numbers, not actual latitudes and longitudes to impose markers on buildings on the map. I utilized the parcel map from 2022 for Boston with its shapefiles (unfortunately 2023 is not available yet from ARCGis). I wanted to keep the map a bit lighter, so I used the polylabel library to find a "center" of a building that was within its boundaries, rather than centroid which could exist outside. I wrote a loader script that zipped the parcel lat/long data together with the subset of fields I wanted from the buildings data set, and output the new dataset as a zip file. Also, don't be like me and read the docs that say that the loader file name needs to match the FileAttachment name you put into your components or Markdown doc.
The Markdown File
Within index.md, I ran afoul of some async commands and had to split my javascript across a few cells. I'd like to go back and figure out exactly what triggered the bad behavior, or if it's more of a hot reloading symptom/issue because of the map. The aforementioned issue with the loader file name did introduce some questions about what you'd do if your data loader needed to have multiple output files. As far as I could tell, you would need to have a single output zipped archive and then unpack each individual file with ${unzipped_object}.file(${filename}).csv(). Because I had zipped the loader data as a csv to make it lighter than JSON or GeoJSON, I needed to handle transformation to GeoJSON client side and load it as a data source within my map.
const geoBuildingData = {
  type: "FeatureCollection",
  name: "geoBuildings",
  crs: { type: "name", properties: { name: "urn:ogc:def:crs:OGC:1.3:CRS84" } },
  features: [],
};

const bldData = await buildingData.file("buildings_data.csv").csv();

const buildingTypologies = new Set(
  bldData.map((feature) => feature.building_typology)
);

bldData.map((feature) => {
  const { point: rawPoint, ...rest } = feature;
  const point = rawPoint.split(",").map((value) => parseFloat(value));
  geoBuildingData.features.push({
    type: "Feature",
    properties: { ...rest },
    geometry: { type: "Point", coordinates: point },
  });
});

...

map.on("load", () => {
  map.addSource("bld-data", {
    type: "geojson",
    data: geoBuildingData,
  });
})
I also got real sloppy with some CSS to try and recreate the look and feel of some of the other maps I've built. It was a bit painful to figure out what to target and how to override the styles. I know that when you create an Observable Framework project, you can select a style, but I do wish it was a bit easier to customize after that first step.
For this prototype I used project hosting with Observable because I wanted to see what the deploy process would look like. It was easy! The only hiccup I ran into was that I couldn't figure out how to set access to the map as public once I had deployed (it defaulted to private), but it turns out a newer version of Observable Framework allows you to set the project up as public when you're initially configuring the project from the CLI. The Observable team is also responsive, so I had an answer on the forum less than two hours after I asked!
Things This Prototype is Not
- optimized for performance - in a world where I have an infinite amount of time for side projects, I'd build my loader to directly make map tiles based on the building data layer.
- the cleanest code - I could probably separate out all the map data into a component. Maybe I will do that later (I took a stab at it and had some issues with the Runtime library)
- optimized for mobile - I didn't extend zoom levels far enough for the basemap (only to level 15) to be able to use fat fingers to select individual markers easily.
- bug-free - The heads up display seems to duplicate or come in the wrong order on some devices/browsers so it becomes difficult to read the text (#worksonmymachine)
Takeaways
I could definitely see myself moving away from Gatsby (which is what I currently use for this blog) and rewriting using Observable Framework. I'm currently working off of a custom fork of my Gatsby theme to support mdx specifically because I want to be able to load in React components and visualizations both from Observable notebooks, as well as local components. I break things a lot with Gatsby, and more often than not, I get some new whack-a-mole issue with GraphQL when I gatsby develop a new blog post after a few months. I think Observable Framework might make this easier for me to do, but I'd have to give some thought as to how to change over the existing work which utilizes React to manage some state for the interactive visuals (but even in some of those cases, I was using Observable's cell takeout so it seems like that shouldn't be too onerous).
The original plan for this project was to also include marker filters via a select input based on the building type (which is currently used to color code markers). However, I couldn't figure out how to pass an event handler to the Observable Input that would update the map. I know how to do this in React using useRef hooks for libraries that require manipulating the canvas (ThreeJs, Maplibre-GL-JS), but outside of working directly with html inputs, I didn't know how to accomplish this with Observable components (wrestling with styling raw HTML inputs is not how I want to spend my free time). I created a div in the markdown file and then used that as the container for the map, but I couldn't access that reference in a different js cell. I also had to host my map font files elsewhere, rather than in the same location as the pmtiles file.
const features = display(document.createElement("div"));
features.id = "features";
features.style = "z-index: 100";
const mapContainer = display(document.getElementById("mapContainer"));
mapContainer.appendChild(features);

const div = display(document.getElementById("mapContainer"));
const windowHeight = window.innerHeight;
const windowWidth = window.innerWidth;
div.style = `position: relative; height: ${windowHeight - 50}px; width: 100%`;
const map = new maplibregl.Map({
  container: div,
  zoom: 12,
  maxZoom: 14,
  minZoom: 10,
  maxBounds: [
    [-71.191247, 42.227911],
    [-70.648072, 42.450118],
  ],
  center: [-71.08936258403622, 42.3181973483706],
  style: {
    version: 8,
    sources: {
      openmaptiles: {
        type: "vector",
        tiles: ["pmtiles://" + mapFile.source.getKey() + "/{z}/{x}/{y}"],
      },
    },
    layers: mapStyle.layers,
    glyphs:
      "https://m-clare.github.io/map-glyphs/fonts/{fontstack}/{range}.pbf",
  },
});
Outside of these issues, this was a pretty fun way to test some of the edges of Observable Framework. Next steps will be testing out self-hosting with Digital Ocean, trying to refactor the map into its own reuseable component, and (maybe) mucking around with inputs again.
Acknowledgements
Thanks to Brandon Liu, the creator of Protomaps for quickly troubleshooting the initial issues with loading pmtiles, and creating a sample map example which I used to develop this project.