Making 3D Hexplots With Maplibre
One of the curses I've found about being a software developer is knowing there has to be a way (or a better way) to do something, and then nerd sniping yourself until you figure out how to do the thing.

Cue me, over Christmas break, wanting to make a map. I knew I could do some 3d visualization based on some of the Maplibre examples, but I had a very specific idea in my brain of what I wanted to make.
I'd done a lot of work with Bridge.Watch using D3 for 2D data visualizations, but I really wanted to see what I could add as 3d data on a real map, rather than just a country/state/county svg from the TopoJSON U.S. Atlas.
To further complicate things, I really liked the visualization I'd done with hexbinning for the national bridge overview.
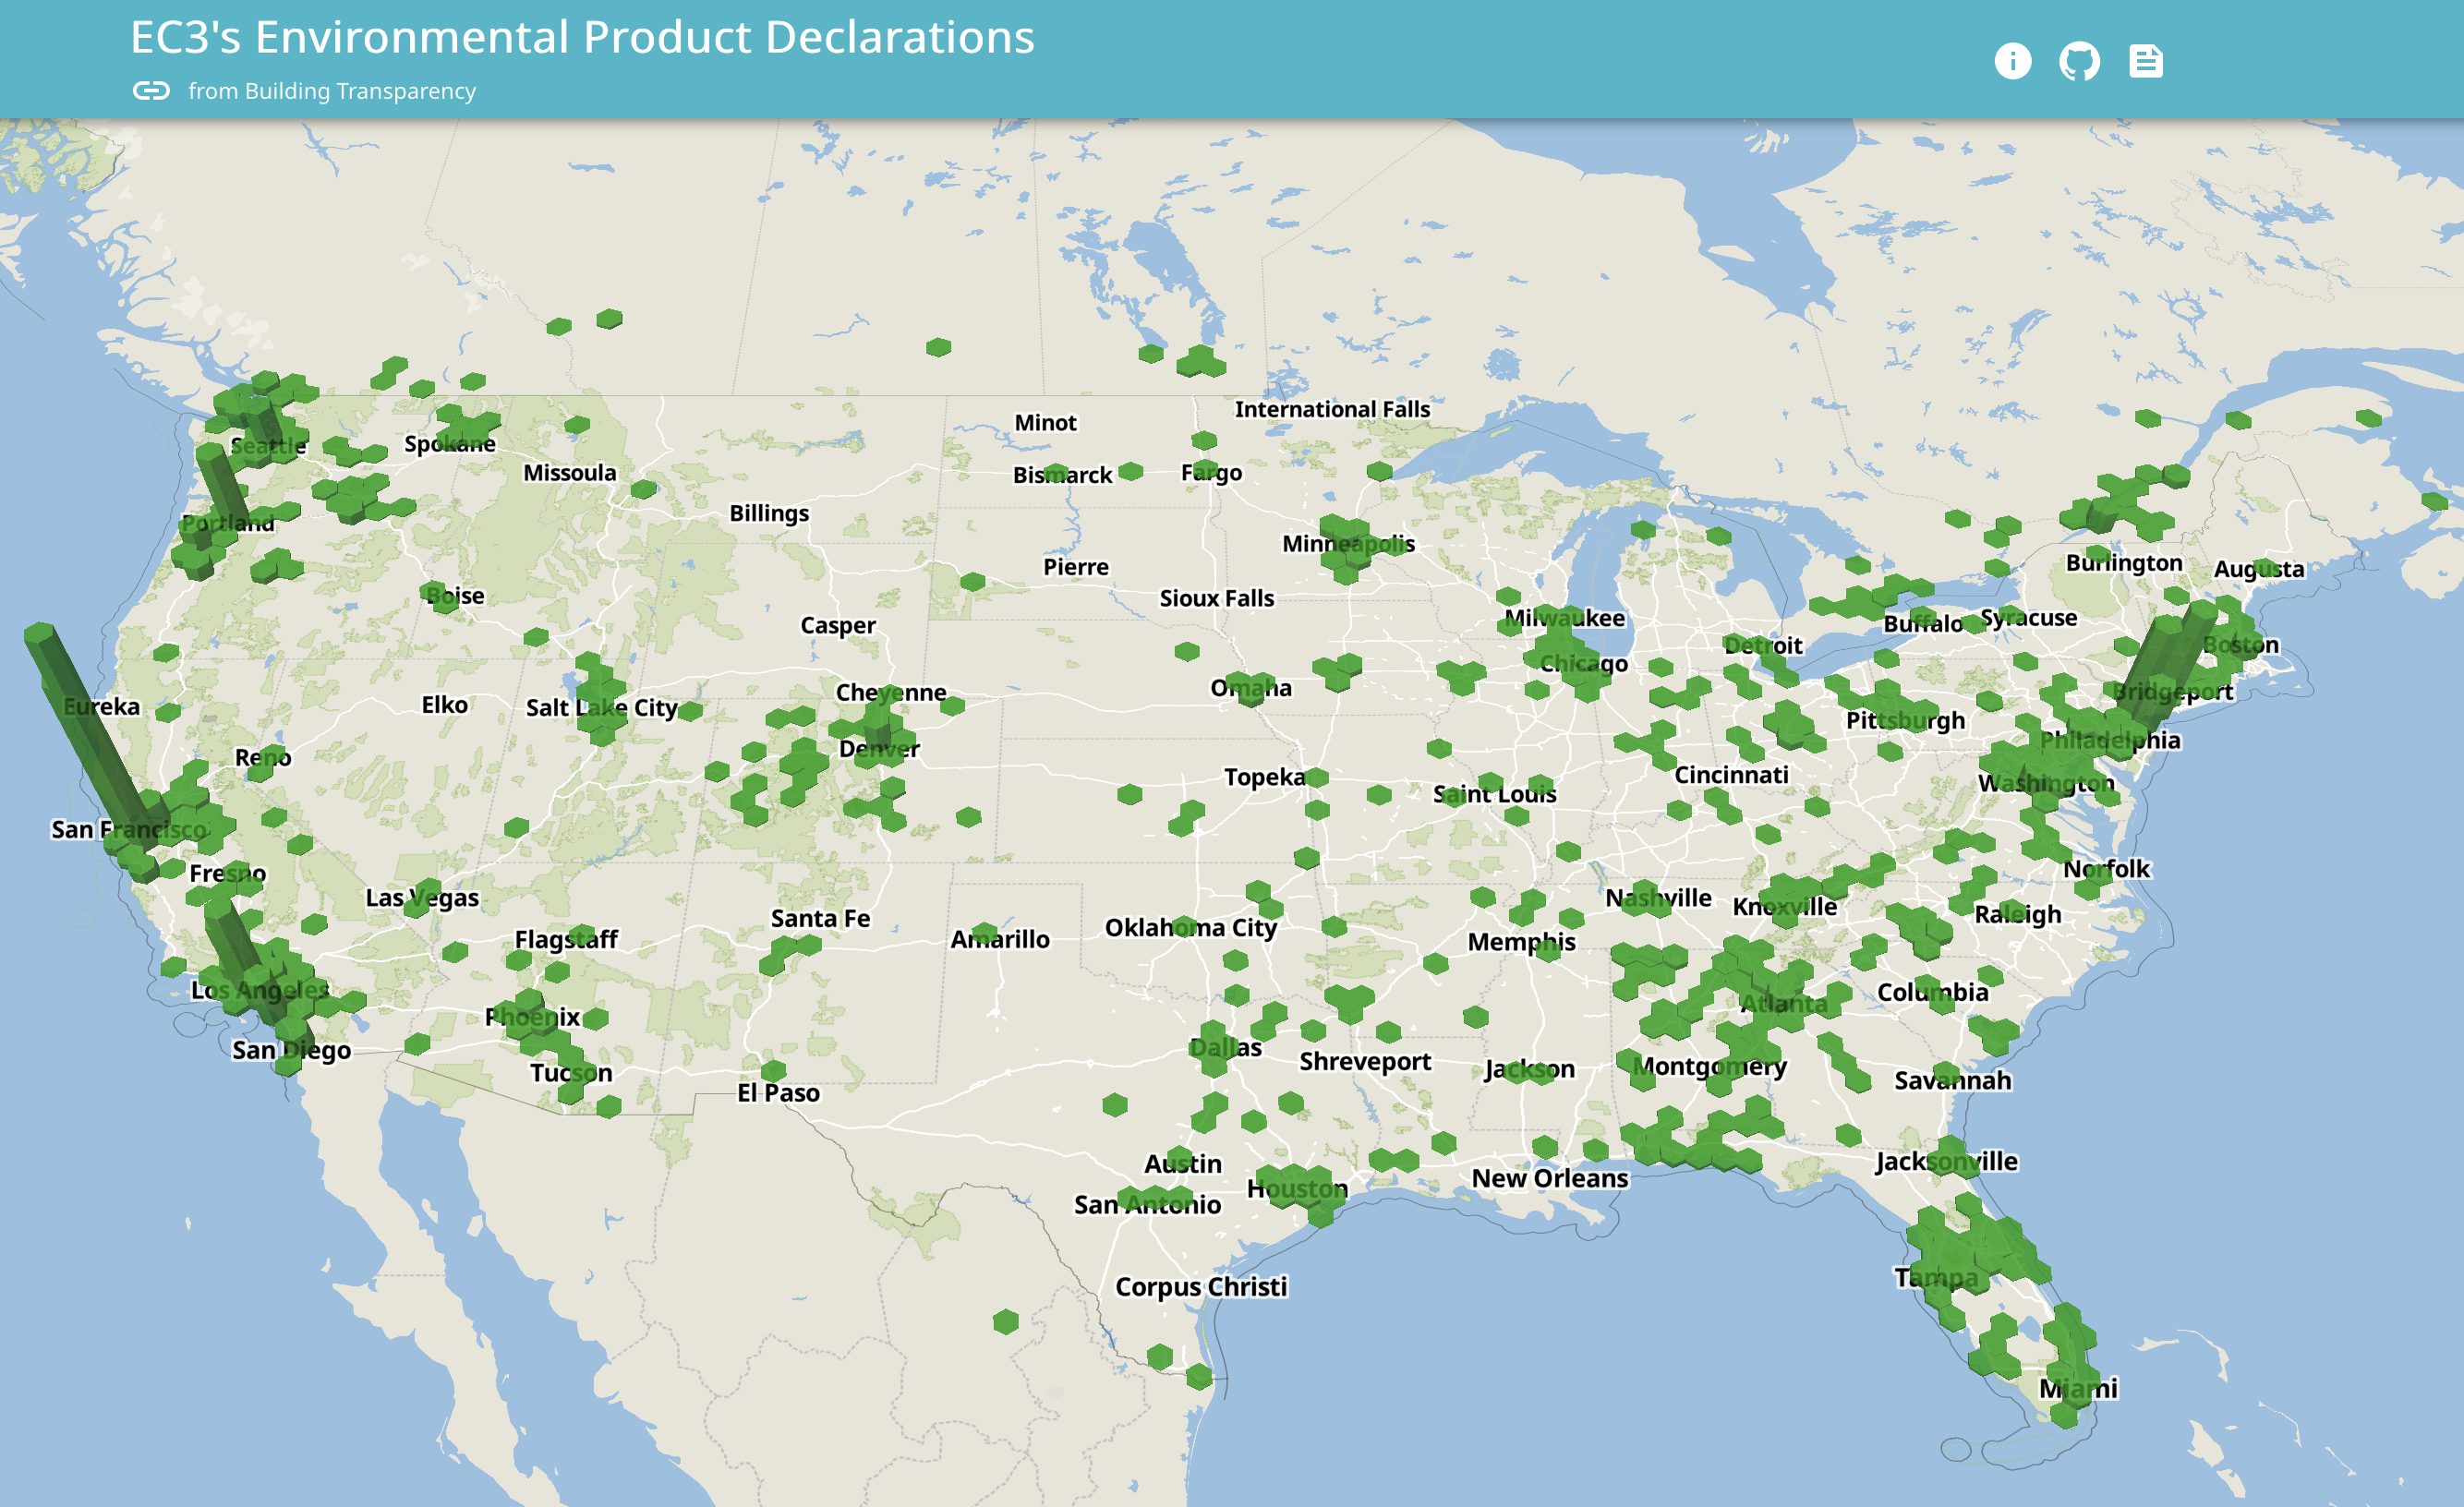
I wanted a 3D hexbin, and after a bit of mucking around with some hacky scripts, I finally have it.
To utilize the d3-hexbin library rather than rewriting my own hex functions, I had to transform the data into the projected coordinates of a 2d visualization, and then transform them back out to latitudes and longitude coordinates that could be stored as polygonal features in a geojson.
Projection and Hexbin functions
const width = 975;
const height = 610;
const scaleValue = 1300;
const radius = 6;

const projection = d3
  .geoAlbersUsa()
  .scale(scaleValue)
  .translate([width * 0.5, height * 0.5]);

const customHexbin = hexbin()
  .extent([
    [0, 0],
    [width, height],
  ])
  .radius(radius);
I used the same width/height/scaling I'd used in a few other maps, and played with the radius a bit to come up with the right balance of bins to data.
The data I wanted to plot was all the plants and factories contained within the EC3 Environmental Product Declaration Database. The data set wasn't too large, and I knew it would have a fairly sparse distribution, with a lot of the EPDs coming from plants in metropolitan areas and ports. I ran the material data through the projection function and filtered out any EPDs/Plants that were missing latitudes and longitudes before running it through the customHexbin function.
let hexBins = [];
if (Array.isArray(materials)) {
  const projectedData = materials
    .map((d) => projection([d.longitude, d.latitude]))
    .filter((d) => d !== null);
  hexBins = customHexbin(projectedData);
}
The hexbin API is pretty limited. The most I could figure out for actually getting the points was to run the hexbin.hexagon([radius]) function, obtain the svg path, and then extracting the points from the path data using a very complicated regular expression. I did this for a single baseHex centered at the origin, and then offset all the other points based on the center points of each hex, which I could extract via hexbin.centers().
function svgPathToCoordinates(pathData) {
  const coordinates = [];
  const pathCommands =
    pathData.match(
      /[a-df-z]?\s*-?\d+(\.\d+)?(?:[eE][+-]?\d+)?,?\s*-?\d+(\.\d+)?(?:[eE][+-]?\d+)?/g
    ) || [];

  let currentX = 0;
  let currentY = 0;

  let startingPoint = [];
  pathCommands.forEach((command) => {
    const cmd = command[0];
    const values = command
      .slice(1)
      .split(/[,\s]+/)
      .map(parseFloat);

    switch (cmd) {
      case "m":
        currentX = values[0];
        currentY = values[1];
        coordinates.push([currentX, currentY]);
        startingPoint = [currentX, currentY];
        break;
      case "l":
        currentX = currentX + values[0];
        currentY = currentY + values[1];
        coordinates.push([currentX, currentY]);
        break;
    }
  });

  coordinates.push(startingPoint);

  return coordinates;
}

const baseHex = svgPathToCoordinates(customHexbin.hexagon(radius));
Once I had the base coordinates for the properly scaled hexagon, I simply mapped all the hexbins to their projected coordinates (so within the 975 x 610 box), and inverted the projection to obtain the latitudes and longitudes of the hexes, and then made the properly shaped polygon feature with a height attribute of the length of the hexbin (how many items fall within the boundaries).
const hexFeatures = hexBins.map((hex, i) => {
  const newCoordinates = baseHex.map((point) => [
    point[0] + hex.x,
    point[1] + hex.y,
  ]);
  const latLong = newCoordinates.map((point) => projection.invert(point));
  return {
    type: "Feature",
    geometry: {
      type: "Polygon",
      coordinates: [latLong],
    },
    properties: {
      count: hex.length,
      height: hex.length,
      base_height: 0,
      color: "green",
    },
    id: `h_${i}`,
  };
});
I wrote all the hexes as a FeatureCollection to a JSON file, and then loaded the static file into an existing Map component:
map.on("load", function () {
      map.resize();

      map.addSource("hexes", {
        type: "geojson",
        data: hexbins,
      });

      map.addLayer({
        id: "boundary",
        type: "fill-extrusion",
        source: "hexes",
        paint: {
          // See the MapLibre Style Specification for details on data expressions.
          // https://maplibre.org/maplibre-style-spec/expressions/

          // Get the fill-extrusion-color from the source 'color' property.
          "fill-extrusion-color": ["get", "color"],

          // Get fill-extrusion-height from the source 'height' property.
          "fill-extrusion-height": ["*", ["get", "height"], 100],

          // Get fill-extrusion-base from the source 'base_height' property.
          "fill-extrusion-base": ["get", "base_height"],

          // Make extrusions slightly opaque for see through indoor walls.
          "fill-extrusion-opacity": 0.8,
        },
      });
    });
I'm sure with a little work, I could skip the writing/loading step, and even make the hex sizing interactive on the UI, but for now, this is enough to keep me out of the road.