Mapping Los Angeles' Soft-Story Retrofit Program
Los Angeles' Soft-Story Retrofits
Motivation
In the wake of the 7.8 magnitude earthquake that devasted parts of Turkey, a lot of press in the U.S. turned to what could happen if a similarly sized earthquake occurred on the west coast. One story from the LATimes focused on the risks of "soft-story" failures in single family homes, but also mentioned the previous initiative to retrofit multifamily condos and apartments throughout Los Angeles. There are some rudimentary bar charts based on council district currently available from the Los Angeles Department of Building Services' (LADBS) website, but I wanted to try out some open source mapping and work with Postgis to see how difficult it would be to get a detailed map of all soft-story retrofits (and which ones were still outstanding) as of April 1, 2023.
The data
I had several xlsx files containing 23,059 addresses (many are duplicate addresses from condos; there are only about 13,500 unique buildings) from the original graphic accompanying the story about the soft-story ordinance in the LATimes. However, this data was incomplete for being able to plot locations on a map, as it lacked latitudes and longitudes. I used Visidata to get the files into a format that I could feed into the United States Census Bureau's geocoder. It was able to match 95% of the addresses, which I deemed "good enough" for my purposes (Part of the challenge of this project was to do all of this for free. I could have paid for access to Google's geocoder or another website).
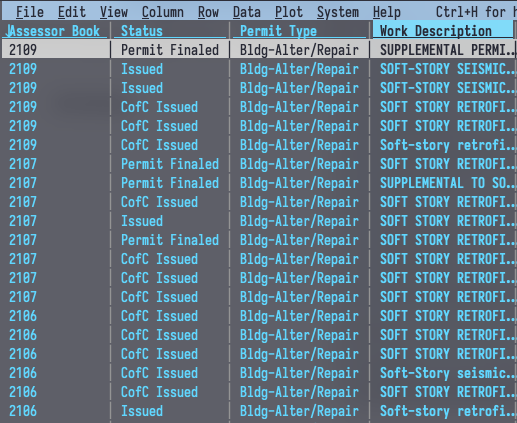
I also had the full list of LADBS permits from LA Open Data, which often include if work is part of the retrofit program in the work_description field. Most of the permits within this data set come with a latitude and longitude, so that made it easier to add this data to the project.
Database in Postgres/PostGIS
The database design was pretty simple. I had a table for the matched geocoded data, as well as a table for the permit data. Once I'd imported the data and cleaned any empty strings from latitudes and longitudes, I was able to create a new column in both tables as a PostGIS ST_Point. I also added a column to do a simple string match on the addresses to filter out all the retrofitted buildings from the LA Times dataset.
In addition to the point information, I also wanted to use PostGIS to highlight the building footprints for retrofit buildings. I ultimately decided not to include this in the final visualization, but I did take some time to utilize Microsoft's publicly available US Building footprints. I did some complicated joins to try and get matching building footprints that contained the permit point data or geocoded point data, but I only got hits on about 8,000 buildings out of 13,500 total. In examining the map later, it was clear that a lot of the points were directly on roads, rather than inside the building footprints. I could have done a Nearest-Neighbor Search with Postgis, but I didn't want to risk getting false highlights on buildings that either didn't need to be retrofitted or already had been.
Once I'd isolated retrofit buildings, missing retrofit buildings, and buildings that were verified as not requiring a retrofit based on the work_description field in LADBS, I used a geojson export from Postgres to create a custom data layer for my map. I did a bit of postprocessing with Observable to cut down on duplicate data and consolidate entries that had the same address (e.g. multiple permits for the same address, or multiple condos at the same address).
Mapping
The happy path for completely free open source mapping turned out to be Geofabrik -> Planetiler -> pmtiles (Protomaps). At the time I was doing this, I also had to use
tippecanoe to convert from the mbtiles I got from planetiler to the pmtiles I needed, but recently, pmtiles support has been added to Planetiler so you can take a osm.pbf from Geofabrik and make pmtiles. I used a default style with some tweaks from OpenMapTiles, but with more time, I could've played around with Maputnik to really customize the look and feel of the map. I utilized Maplibre's example library for a number of elements with the map (the examples are really great for giving you an idea of the breadth of possibilities for mapping!)
Create React App
While I initially scaffolded this using NextJS, I couldn't get around Webpack bundler issues (I ended up using Vite), and I wanted to deploy this as a static site (the actual data layer is only 10 mb). I ended up using Create-React-App with Material UI. With some tweaks to my NGINX configuration to access the app at a subdirectory on https://mclare.dev, I uploaded the results of vite build to my server (which hosts my blog, bridge.watch, and my portfolio site, and had plenty of room leftover for the ~400 mb PMtiles file). One of the best parts of doing this is not needing to set up a full web application with a server, as the map tiles are just stored in the public folder with CRA.
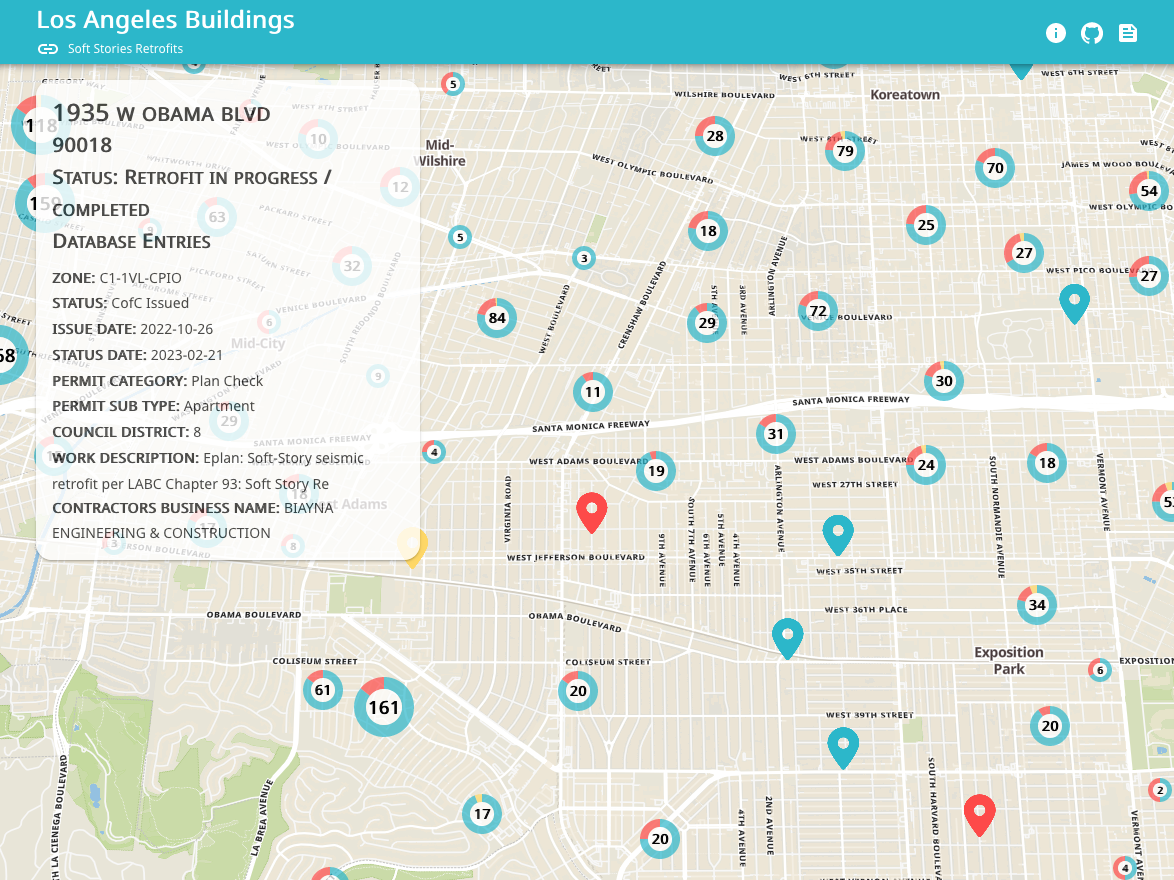
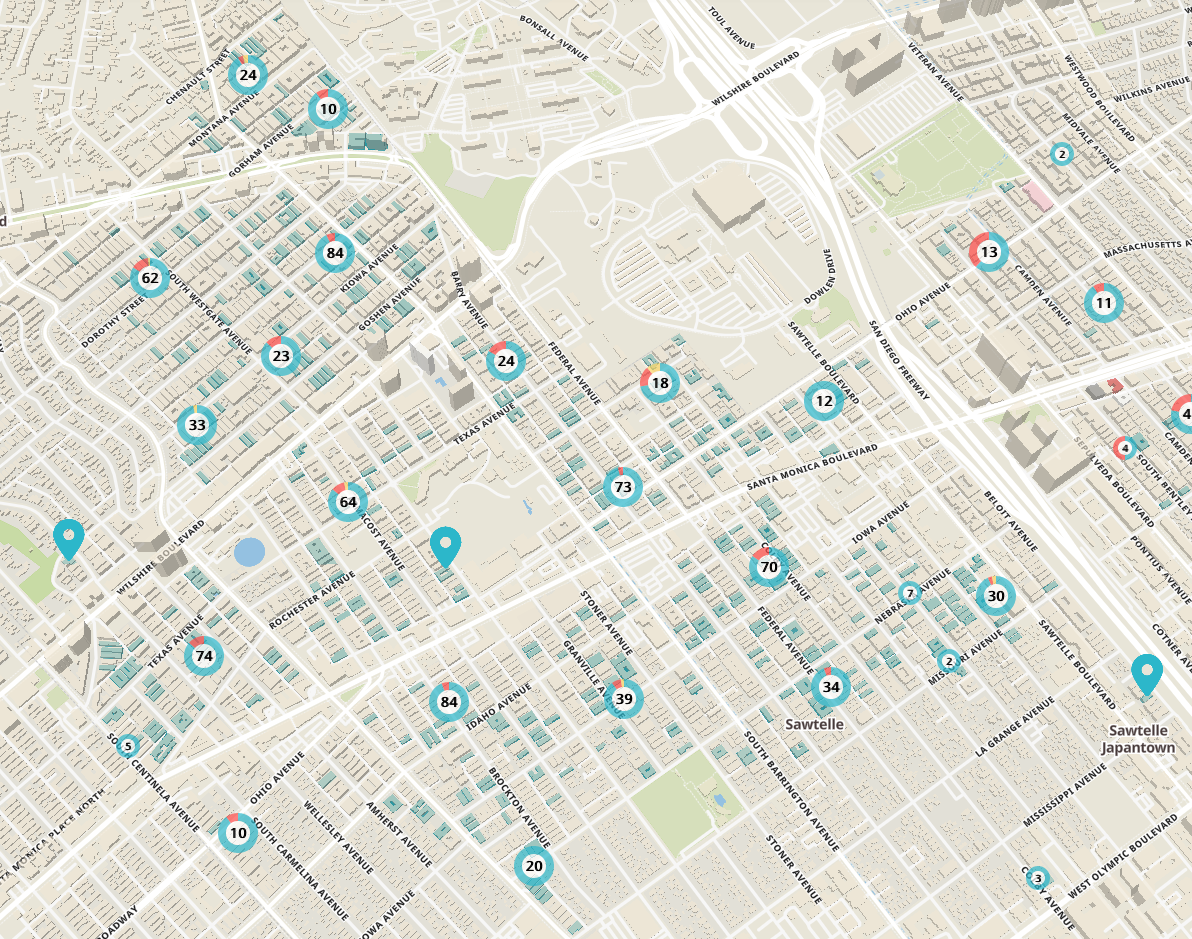
Learning from the Data
I feel like this project only scraped the surface of what could be done with the LADBS Building Permit Data (even just for soft-story retrofits). The map itself allows users to see a number of different fields from the permit database upon selecting a marker, including the contractor responsible, the scope of work (including the type of structural retrofit in some cases!), and the LADBS permit status (some of the retrofits are still in progress). For buildings that are currently missing from the LADBS database, I've kept the log_ids from the original LATimes xlsx files. It's interesting to see the distribution of buildings that were part of the retrofit program, as well as where there are pockets in neighborhoods that have yet to be retrofit. I've already drafted some plots in Observable to take a closer look at which companies are performing the retrofit work (and where they work) as well as the rate at which retrofit work is being done.
Acknowledgements
Many thanks to Brandon Liu, the creator of Protomaps, for answering all my questions (even when they weren't Protomaps related)!