Prototyping Web Applications With Speckle
Motivation
I recently finished reading Scott Young's book, Ultralearning, and one of the principles that I really identified with was "Directness" which promotes Project-Based Learning as a tactic for getting stuff done. Ironically, I actually took an entire course in grad school on Project-Based Learning and hated it at the time. However, throughout my career, scoping and completing smaller projects (while sometimes having no knowledge of the domain beforehand) has been really what's pushed me as a software developer.
I've been following the OSArch group's advocacy of IFC and other open data formats as a way to buck opaque industry-standard software for quite a while (particularly with BlenderBIM). Since I started focusing on software development, I haven't really had a need to use IFC, as I'm rarely working on an actual building project.
In the same vein, I haven't had a need to really work with Speckle, since I'm no longer working on projects that require a lot of coordination between disciplines (though I have been itching to try out what source control means when applied to a building model).
I also wanted to brush up on my life cycle assessment knowledge (which has been languishing since graduate school as well), since I had signed up a few weeks ago to attend an all day seminar on sustainability in structural engineering. I knew that the EC3 tool was one of the few freely available repositories for Environmental Product Declarations (EPDs), but I'd only worked with the web interface. Building a web application that would utilize all three components seemed like a good way to get an idea of the difficulty of working with both the Speckle and EC3 APIs, as well as forcing me to take a closer look at IFC, since I would take one of the prototypical building models to do so.
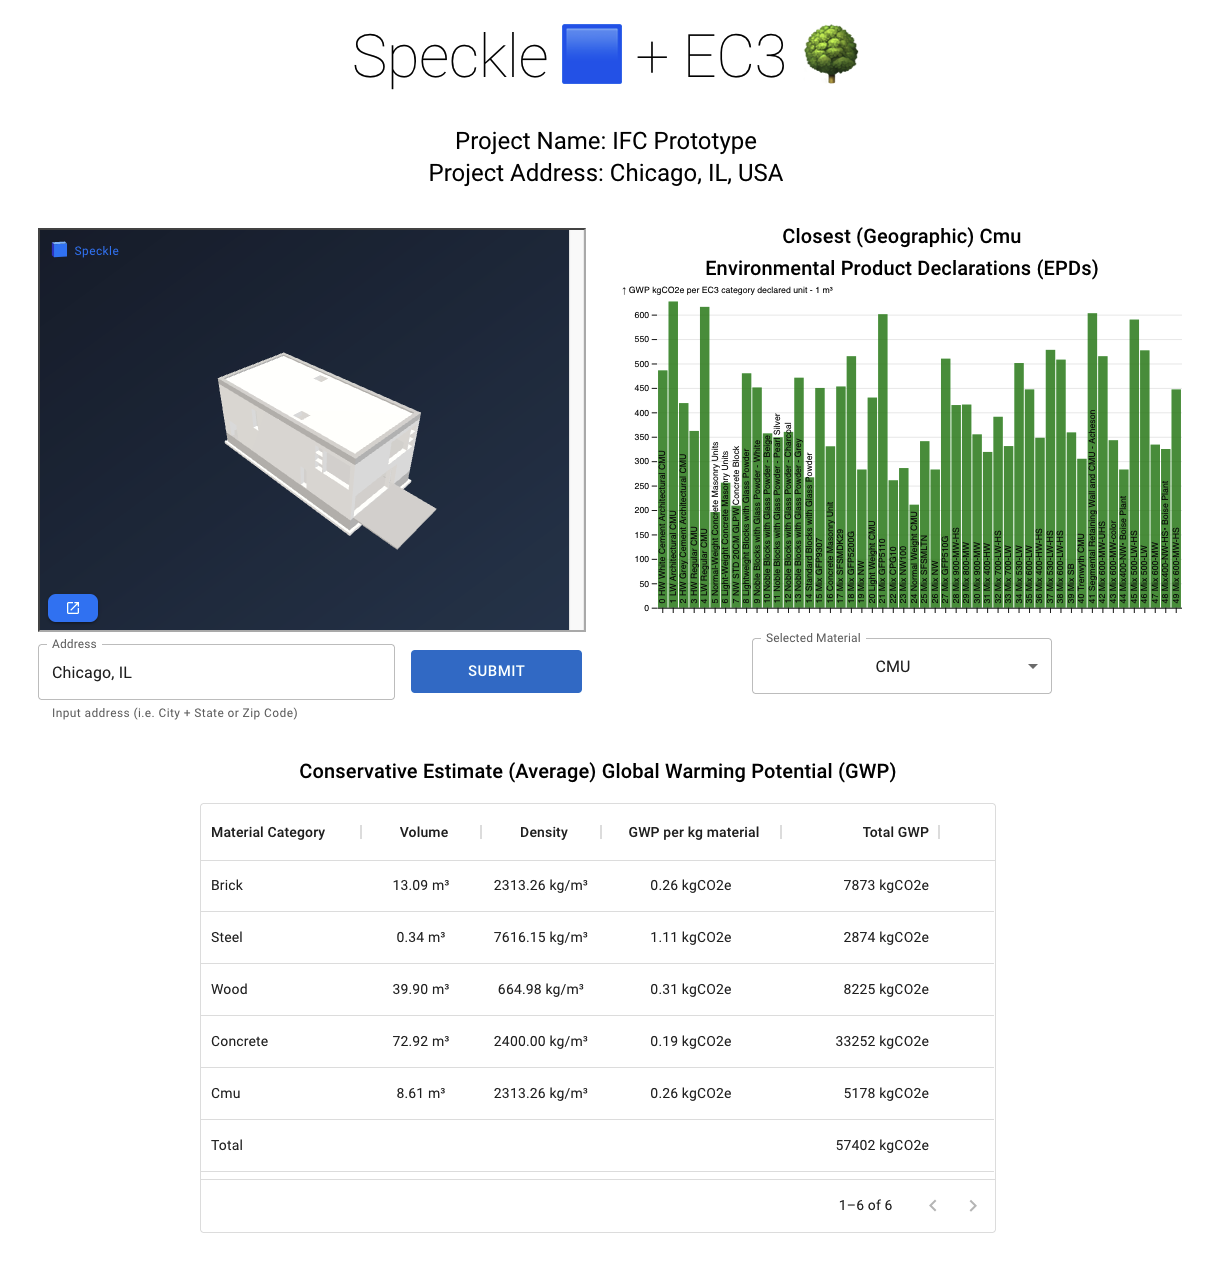
The end result of this exploration is a small React app that shows the estimated embodied carbon (Product Stage A1-A3 in Life-Cycle Stages), and allows for site updating while pulling EPDs per material for up to 50 of the closest geographically matching EPDs. It also uses D3 to create a bar chart of the spread of embodied carbon values for each material. While you wouldn't normally move a project around, I was curious how much these geolocated values would change, particularly since distance of materials to site can factor into other sustainability related metrics (and is something that is considered in a full life cycle assessment as stage A4).
NOTE: I can't deploy this application on a publicly accessible server, because it violates ToS for the EC3 API (you have to use your own credentials for the service). To try this out for yourself you'd need to download the repository and run the front end and back end on different ports locally, as well as adjust the
.envfiles to the right variables (using your own credentials). If you're Docker savvy, I've included a docker-compose development file as well.
Initial Steps
buildingSMART is responsible for IFC's development as an open, international standard for built environment assets. Their github contains a number of sample test files, so I pulled the one for a Duplex Apartment which I had seen elsewhere. (It's also listed in the Usage examples for IfcOpenShell which is an open-source project well worth looking into).
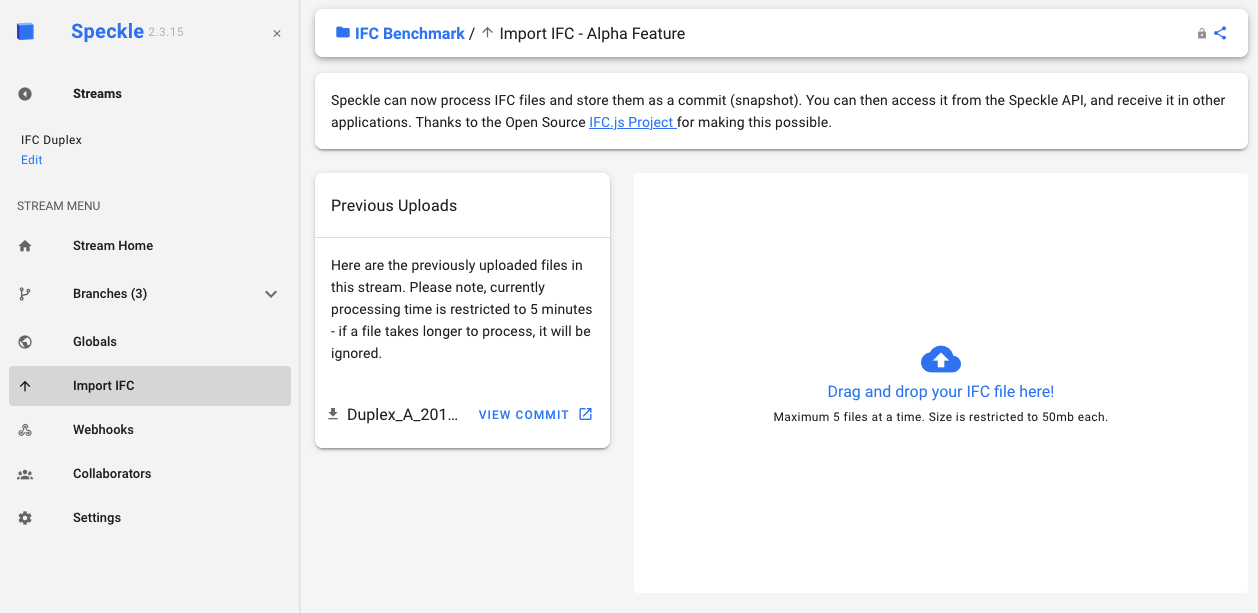
Getting the IFC file into Speckle was about as easy as you can get. All you need to do is create a stream, and drag and drop the IFC file onto the canvas.
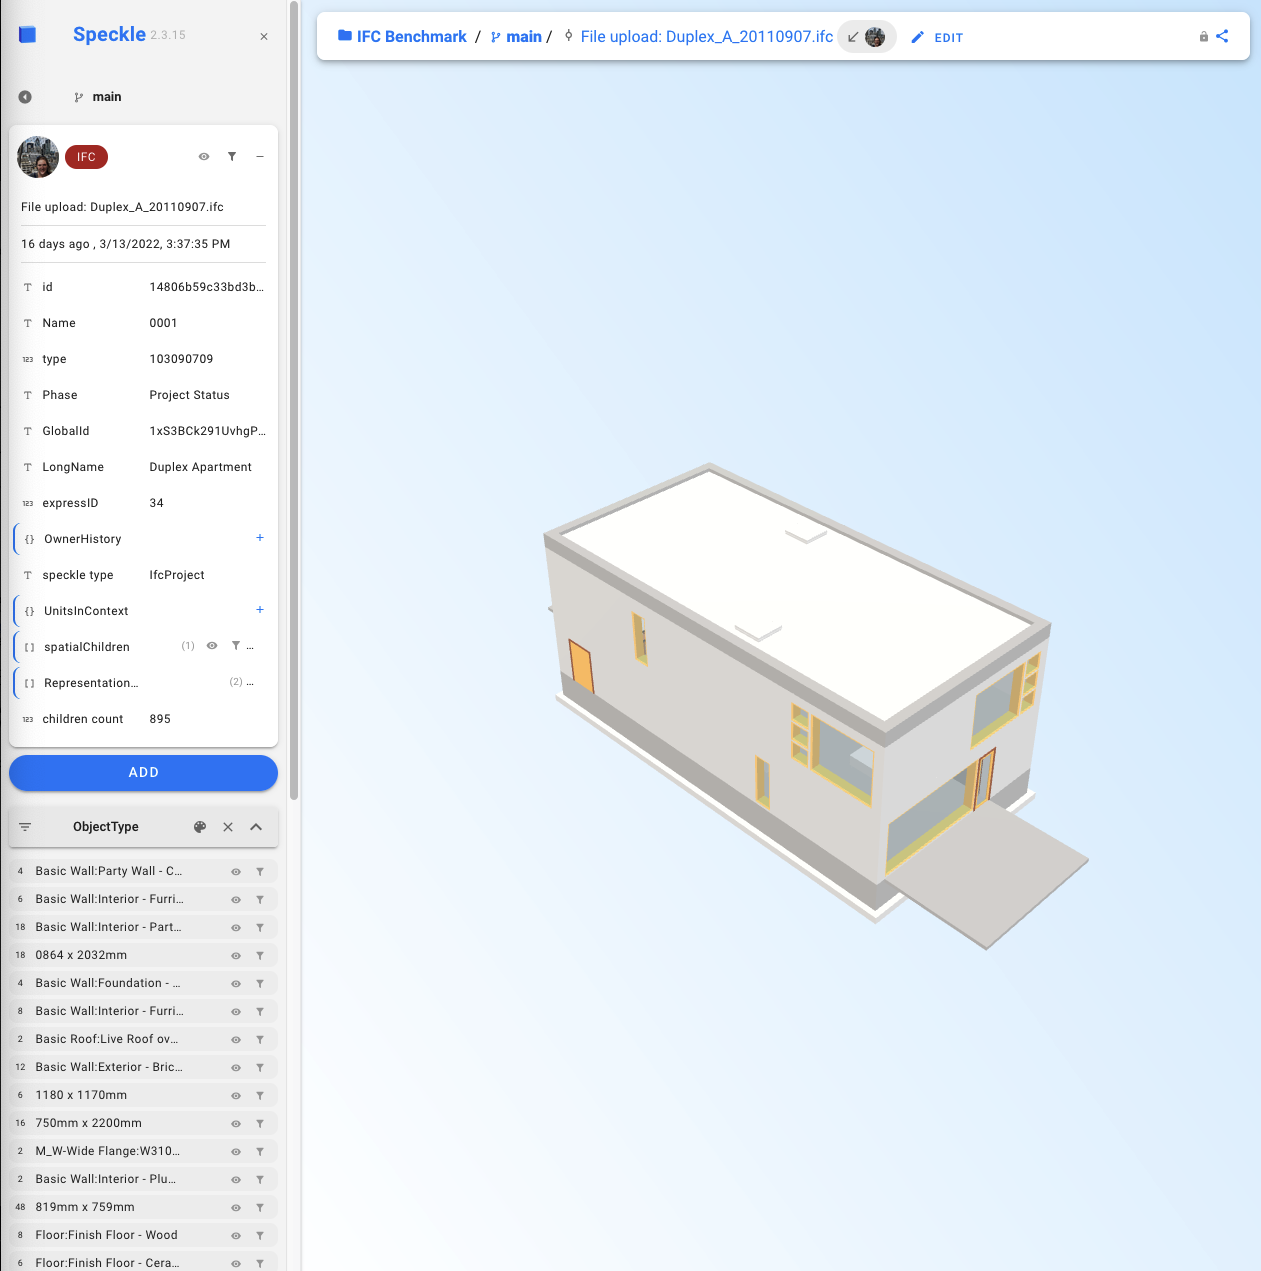
Once the file is uploaded to Speckle, you should be able to view it in their 3d viewer, and even filter by ObjectType to isolate parts of the structure, like the foundations or the walls.
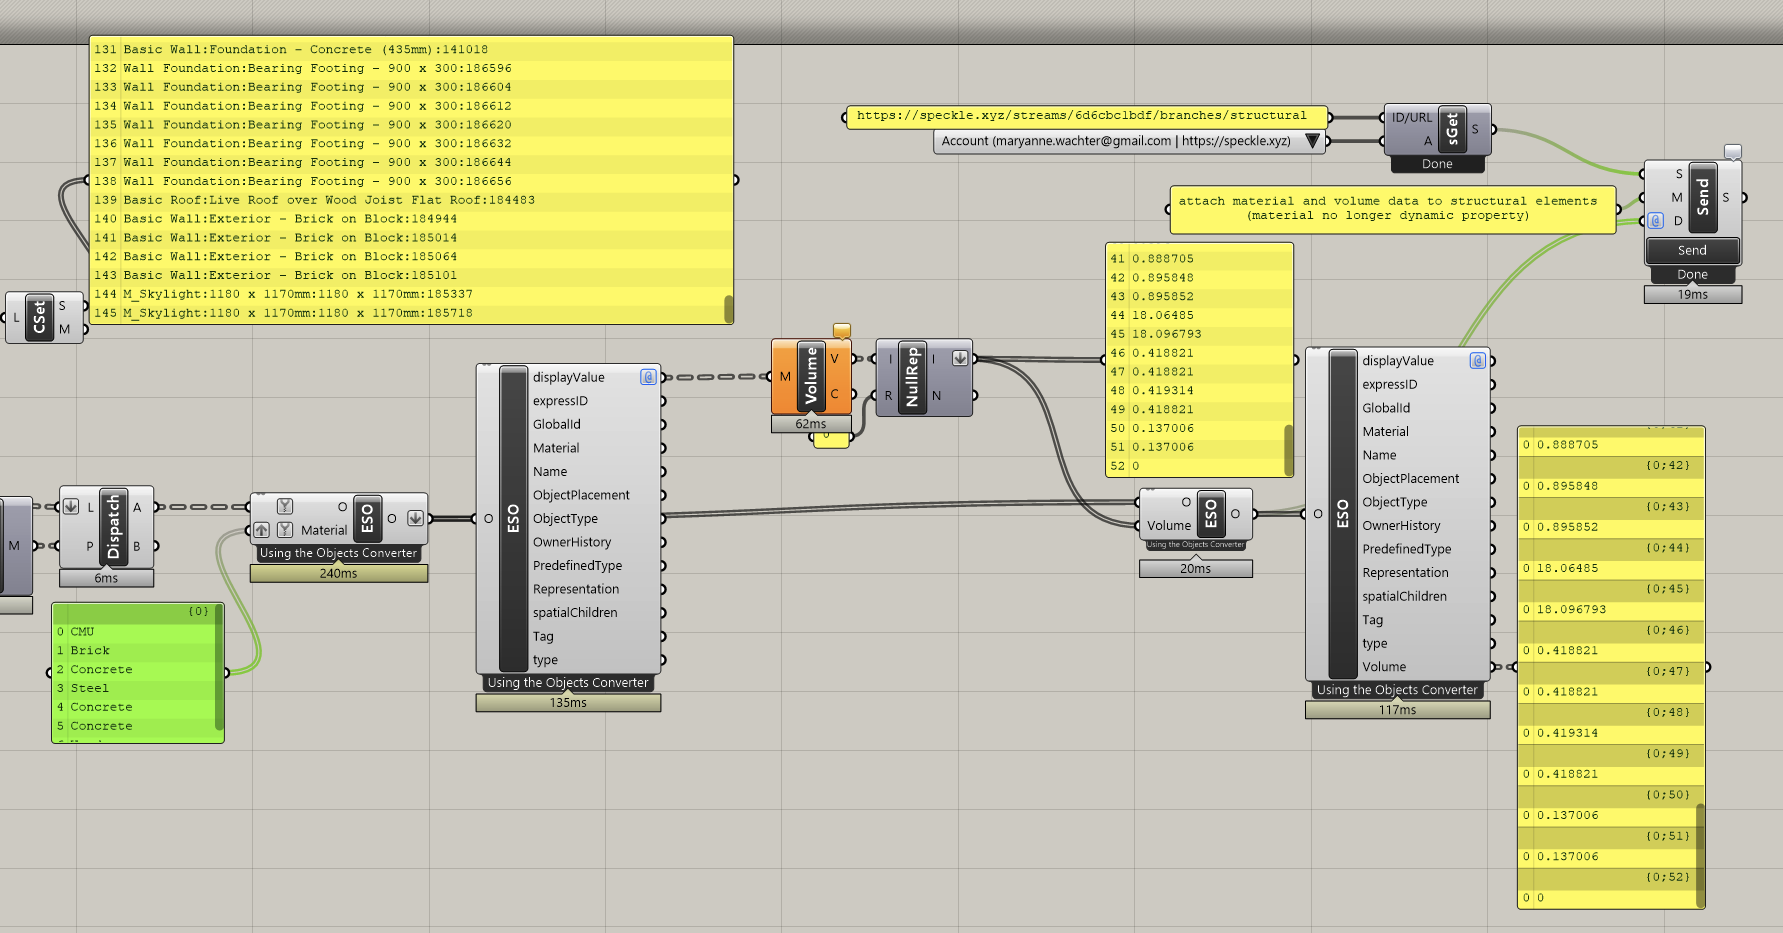
Since I started with uploading the base IFC file, I didn't check to see if IfcQuantityVolume entities were attached to the elements. Rather than wrestling with adding these properties, I took a shortcut (and took advantage) in Speckle, where I could use the Grasshopper adapter to isolate material categories based on the IFC name and attach non-dynamic properties to both indicate the material type (keeping it really simple with just "Concrete", "Steel", "CMU", "Wood", and "Brick" as options) and get the volumes of the meshes using the geometry from IFC. Ideally you would want some kind of direct mapping from the Speckle material type (or IFC material type) to the EC3 material category type, but this was outside the scope of what I was trying to do.
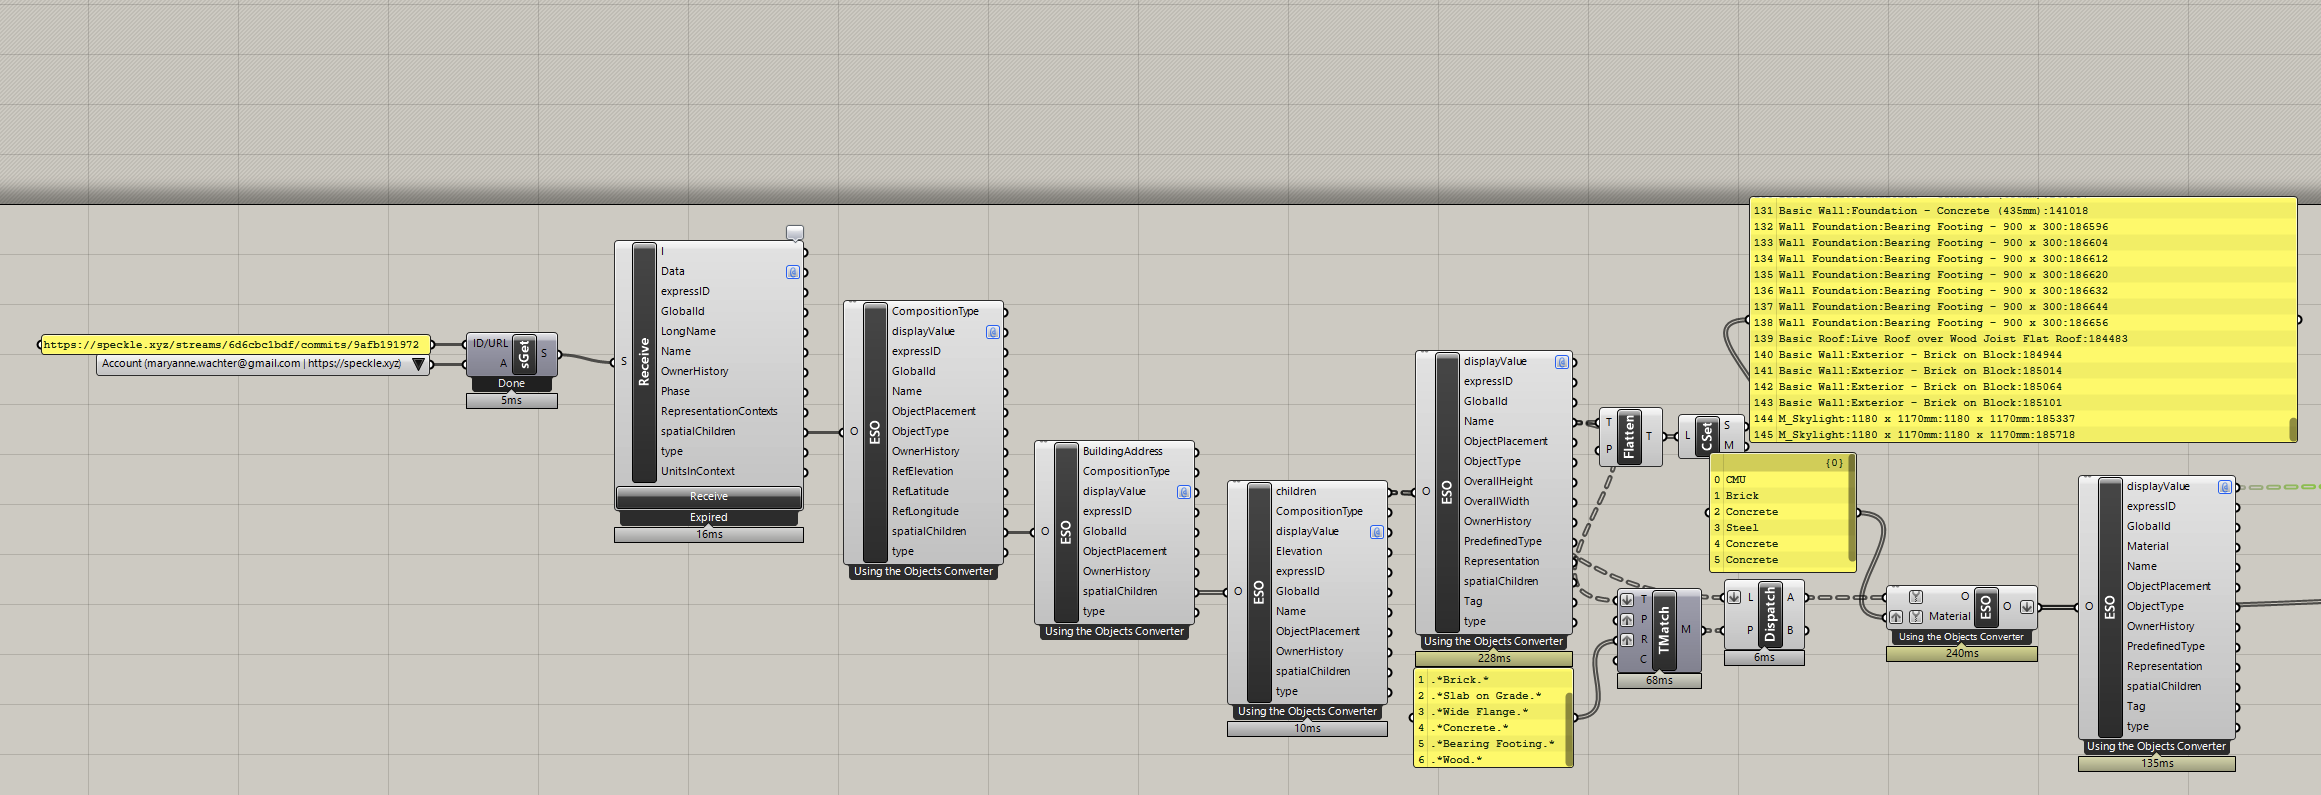
One of the things I discovered from doing this was that unfortunately some of the CMU meshes were not watertight, so I couldn't get a calculated volume on them within Grasshopper (since I was just prototyping I ignored this for now). Once I'd added volume and material properties and isolated the structural type elements, I pushed them to a new "structural" branch on Speckle.
Working with the EC3 and Speckle APIs
Both Speckle and EC3 have APIs that are accessible with a free account on their platform; Speckle uses GraphQL (but also supports a REST API) and EC3 has a standard REST API. As far as I can tell, you cannot access the EC3 API through the browser, so I had to host an intermediary proxy (the backend on github) using NodeJS, while I was able to use Apollo Client to directly fetch my query from Speckle. I decided to use Redis to cache the EC3 queries to avoid hitting the endpoint too much as I did some troubleshooting (my keys were the query string passed from the React front end, consisting of the location and the materials).
Backend
On the backend with Node, I had to update the project location within EC3 to ensure that I was retrieving the 50 closest geographical material results for a given location. The EC3 endpoint for setting an address is pretty forgiving in what it will accept, and will do the best it can with a given string (I tried street addresses, cities, states, and zip codes and all seemed to work. Latitudes and longitudes were a no-go unfortunately).
backend/api.js
const changeProjectLocation = async (locationString) => {
  const headers = await getHeaders();
  const projectInfo = await getProject();
  const location = decodeURI(locationString);
  const body = JSON.stringify({ name: projectInfo.name, address: location });
  return await fetch(baseURL + "/projects/" + projectInfo.id, {
    method: "PUT",
    headers: headers,
    body: body,
  })
    .then((response) => {
      if (response.ok) {
        return response;
      } else if (response.status >= 400 && response.status < 600) {
        throw new Error("Bad response from server");
      } else if (typeof response === "undefined") {
        throw new Error("Response was undefined");
      } else {
        throw new Error("Unknown error in fetch response.");
      }
    })
    .then((returnedResponse) => {
      return returnedResponse.json();
    })
    .catch((error) => {
      console.log(error);
    });
};
I also decided to group all the material calls into a single endpoint, which meant figuring out how to await all of the async calls for retrieving each material category before returning the data to react with the proper data shape.
backend/server.js
const asyncFunctions = dictionary["materials"].map((d) =>
  getMaterial(d, distance),
);
const result = await Promise.all(asyncFunctions);
const resultObj = result.reduce((acc, curr) => ({ ...acc, ...curr }), {});
Rather than wrestling with user input EPD units differing from category declared units (for example, some EPDs functional units are an order of magnitude different than their overall category - 1 kg vs 1 ton, or are volumetric instead of mass based), I decided to prune any material EPDs that weren't the standard volumetric ones. I also had to deal with the fact that the units and values stored in the EC3 database are strings, so I had to parse out the numerical values and the units for each property I wanted to return.
const getMaterial = async (materialName, distance) => {
 ...
 const acceptableUnits = {
    concrete: "1 m3",
    steel: "1 t",
    wood: "1 m3",
    cmu: "1 m3",
    brick: "1 m3",
  }
  ...
  const data = rawData.map((d) => {
        let processedData = {
          name: d.name,
          description: d.description,
          declared_unit: d.declared_unit,
          gwp_per_category_declared_unit: d.gwp_per_category_declared_unit,
          plant_or_group: d.plant_or_group,
        };
        for (const property of propertiesWithUnits) {
          if (d[property]) {
            processedData = {
              ...processedData,
              [property]: {
                value: +d[property].split(" ")[0],
                unit: d[property].split(" ")[1],
              },
            };
          }
        }
        return processedData;
      });
      const filteredData = data.filter((d) => d.declared_unit === acceptableUnits[materialName])
}
Frontend
React + Material UI + D3 have served me well for quickly putting together web applications that look half decent. It's easier than ever now with platforms like Observable allowing users to quickly prototype data visualizations based on their starter templates. I didn't play much with Speckle's Javascript SDK, just opting to embed their 3d viewer as an iFrame (though it would be really cool to link some interactivity between the 3d viewer and some graphs).
Most of the code in frontend is really for styling with Material UI. I only created two components for the bar chart and for the data table.
I just needed one API call for Speckle to retrieve the volume and material data I needed:
const GET_SPECKLEOBJECTS = gql`
  query {
    stream(id: "6d6cbc1bdf") {
      object(id: "ab1a4d9d2c58985b94648a4b105c011e") {
        children(select: ["Volume", "Name", "Material"]) {
          totalCount
          objects {
            totalChildrenCount
            data
          }
        }
      }
    }
  }
`;
Once I summed the volumes for each component by material type from Speckle, I could just do dimensional analysis with the material data pulled from EC3 to generate the table values based on knowing the material density and the global warming potential (GWP) per kg of material. I took the average GWP "Conservative Estimate" value for the 50 (or fewer) closest materials to the site. In addition, I provided a bar chart with the raw EPD data per material that would be averaged to show if there were any outliers. One thing I learned from this exercise is that you really need to get pretty granular with your material specification in EC3, as "Wood" with a description of "Structural Wood Products used in construction" will return standard rough lumber, as well as Plyboo, which will blow up your average EPD value. In the future, it would be nice for the user to be able to click to remove irrelevant materials on the frontend (and this shouldn't be too hard to do).